Debugging Applications with gdb and VS Code
This page shows how to step through your own program on a Cargt board with
a debugger running on your PC: in VS Code, set up by devtool ide-sdk,
or with gdb on the command line. The program runs on the board under
gdbserver; the debugger, the symbols and the source stay on the PC.
The last section shows the other way round: VS Code Remote-SSH, which
builds and debugs a program on the board itself.
The examples are from cargt-image-dev (wrynose) on an i.MX 93 00363 on
the 00428 carrier, and a cargt-imx-xwayland build for
imx93-cargt-00363-00428. cargt-image-dev already contains gdb
and gdbserver. It starts from a build set up as described in
Yocto Development, and uses devtool as in Developing Applications and Kernel Modules.
Preparing the Build
The debugger needs the debug symbols of the libraries on the board, not
only those of your program. Yocto can build them as a second root file
system, rootfs-dbg, next to the image. Add these lines to
conf/local.conf:
IMAGE_GEN_DEBUGFS = "1"
IMAGE_FSTYPES_DEBUGFS = "tar.bz2"
IMAGE_CLASSES += "image-combined-dbg"
# Build your program without optimizations that make stepping jump around
DEBUG_BUILD:pn-hello-debug = "1"
# Workaround, see below
IMAGE_LINGUAS = ""
DEBUG_BUILD is per recipe; replace hello-debug with the name of
your recipe.
Note
With IMAGE_GEN_DEBUGFS the image build fails at do_rootfs with
unmet dependencies of the locale-base-* packages on
glibc-binary-localedata-*. IMAGE_LINGUAS = "" avoids this by
leaving the locales out of the image built for debugging. The board you
debug on can keep its normal image: the libraries are the same.
The settings only change the image built in this build directory. You do
not have to flash this image; the board needs to run an image built from
the same layers, such as cargt-image-dev.
The Example Program
The example is a small CMake program, hello-debug, with a function to
step into:
#include <stdio.h>
#include <unistd.h>

static int add_squares(int count)
{
     int total = 0;

     for (int i = 1; i <= count; i++)
             total += i * i;
     return total;
}

int main(void)
{
     char host[64] = "";

     gethostname(host, sizeof(host) - 1);
     printf("Hello from %s\n", host);
     printf("Sum of squares 1..10 = %d\n", add_squares(10));
     return 0;
}
Its CMakeLists.txt:
cmake_minimum_required(VERSION 3.16)
project(hello-debug C)

add_executable(hello-debug main.c)
install(TARGETS hello-debug RUNTIME DESTINATION bin)
With the source in a Git repository in ~/src/hello-debug, devtool
add creates a recipe for it in the devtool workspace and builds it from
that directory:
devtool add hello-debug ~/src/hello-debug
For a recipe that already exists, use devtool modify <recipe> instead;
see Developing Applications and Kernel Modules.
Debugging in VS Code with devtool ide-sdk
devtool ide-sdk builds everything the debugger needs and writes a VS
Code configuration into the source directory. Give it the recipe, the
image the board runs, and the board’s address:
devtool ide-sdk hello-debug cargt-image-dev -t root@<board-ip> -i code
The first run builds the image, rootfs-dbg and the cross gdb, which
takes a while even when most of it comes from the shared state cache. At
the end it lists the files it wrote:
INFO: Using image: cargt-image-dev
INFO: Setting up workspaces for modified recipe: ['hello-debug']
...
INFO: Updating CMake preset: CMakeUserPresets.json (.../hello-debug/CMakeUserPresets.json)
INFO: Updating IDE config file: settings.json (.../hello-debug/.vscode/settings.json)
INFO: Updating IDE config file: extensions.json (.../hello-debug/.vscode/extensions.json)
INFO: Updating IDE config file: c_cpp_properties.json (.../hello-debug/.vscode/c_cpp_properties.json)
INFO: Updating IDE config file: launch.json (.../hello-debug/.vscode/launch.json)
INFO: Updating IDE config file: tasks.json (.../hello-debug/.vscode/tasks.json)
File |
What it contains |
|---|---|
|
A CMake preset that builds with the Yocto cross-compiler and sysroot |
|
Hides devtool’s |
|
Recommends the C/C++ and CMake Tools extensions |
|
Takes IntelliSense settings from CMake Tools |
|
A task that builds and deploys the program to the board, and one
that starts |
|
The debug configuration: the cross |
The board’s address is written into tasks.json and launch.json.
If it changes, run devtool ide-sdk again.
Install the C/C++ (ms-vscode.cpptools) and CMake Tools
(ms-vscode.cmake-tools) extensions, and open ~/src/hello-debug in
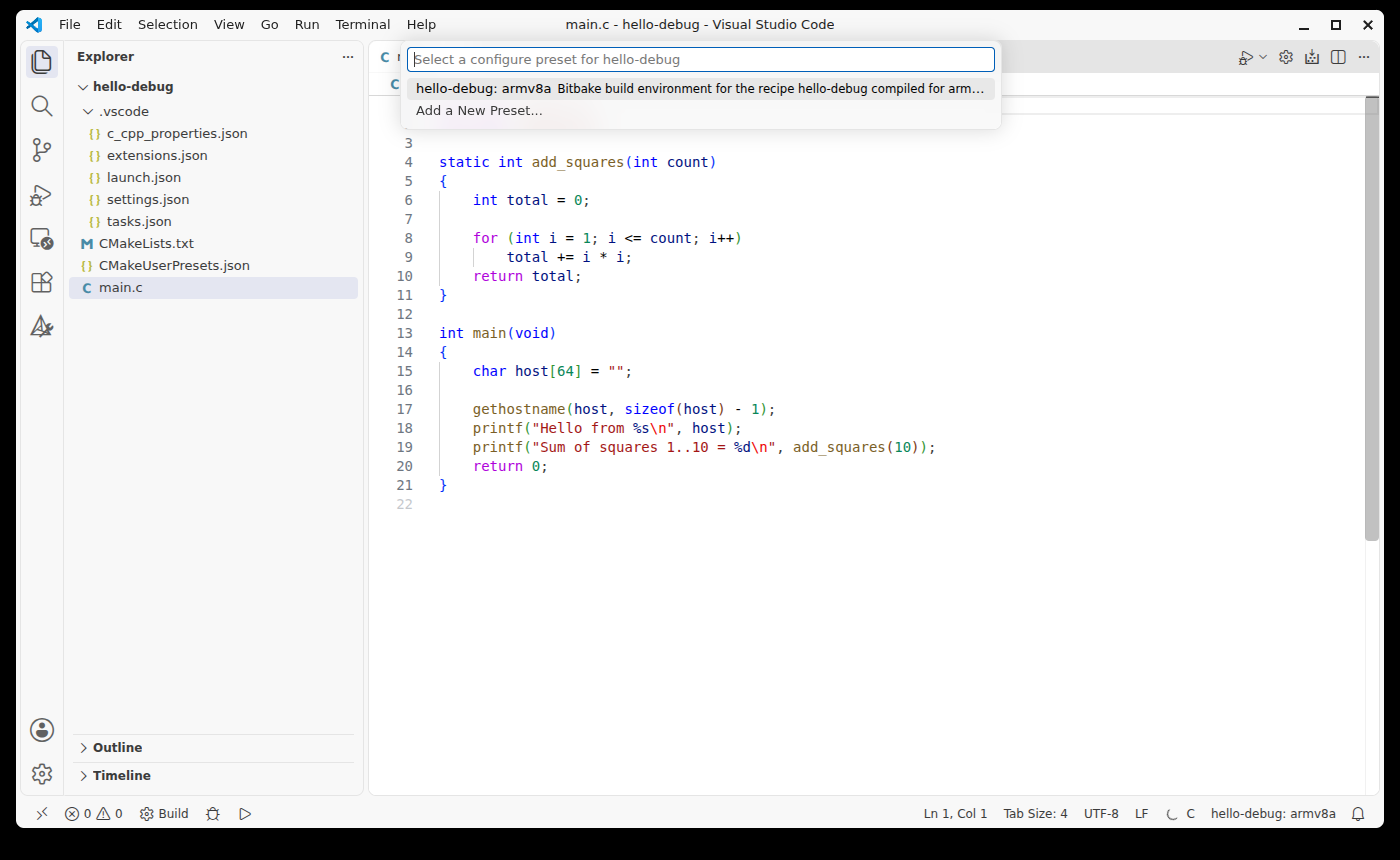
VS Code. CMake Tools asks for a configure preset; choose the one
devtool ide-sdk made:
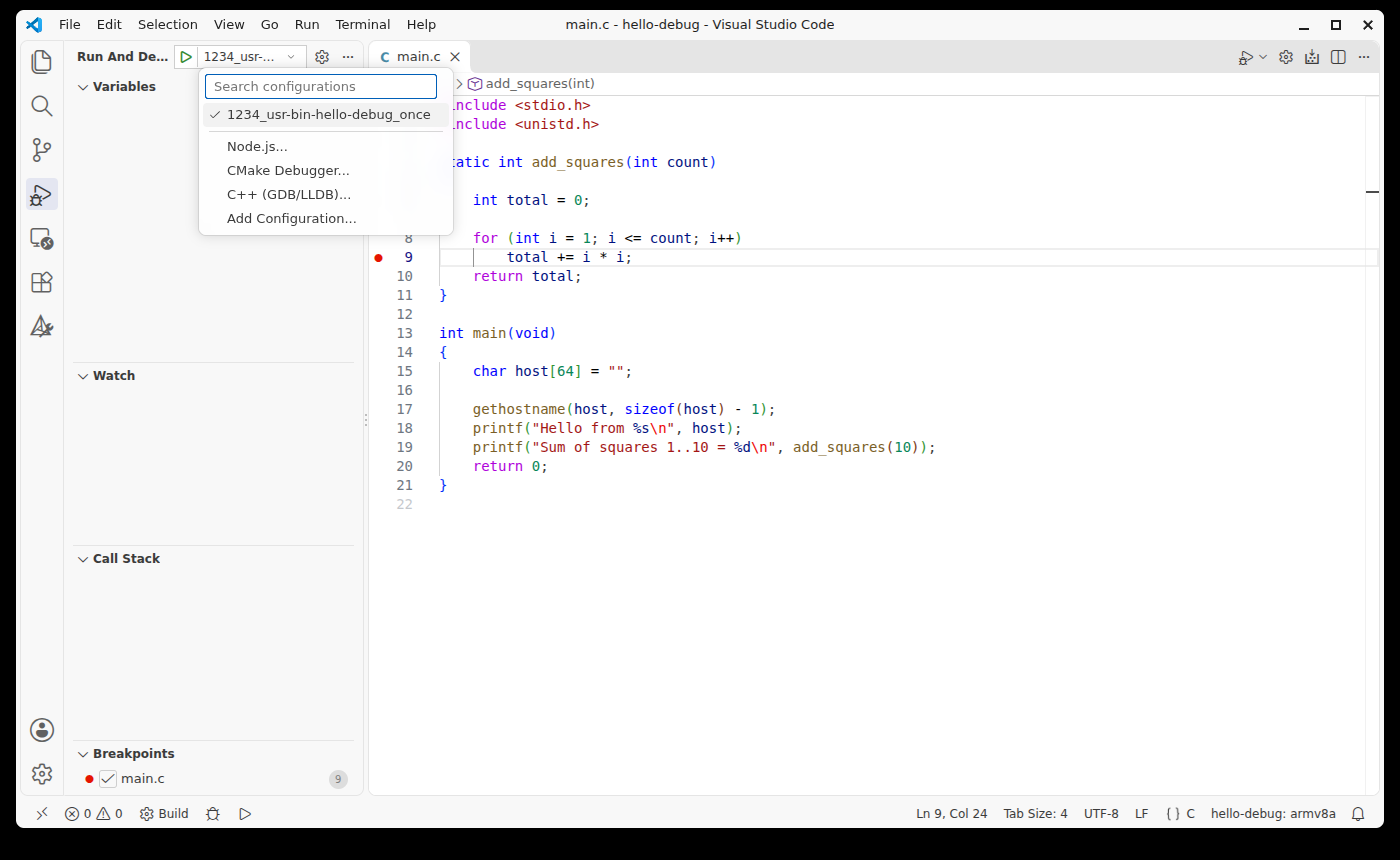
Set a breakpoint, open Run and Debug, and select the configuration
named after the gdbserver port and program, here
1234_usr-bin-hello-debug_once:
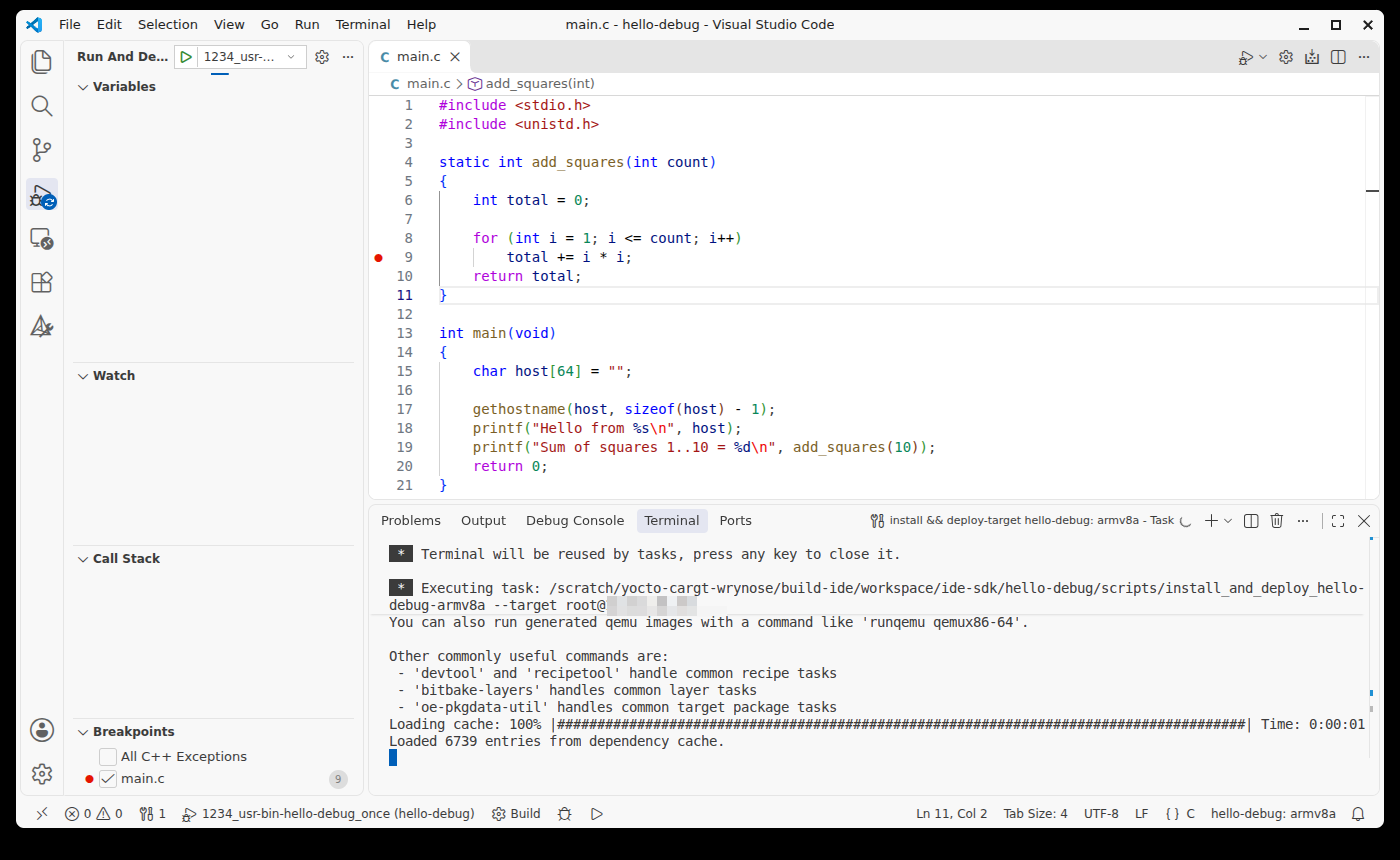
Press F5. Before the debugger starts, VS Code runs the
install && deploy-target task, which builds the program with
bitbake and copies it to /usr/bin on the board:
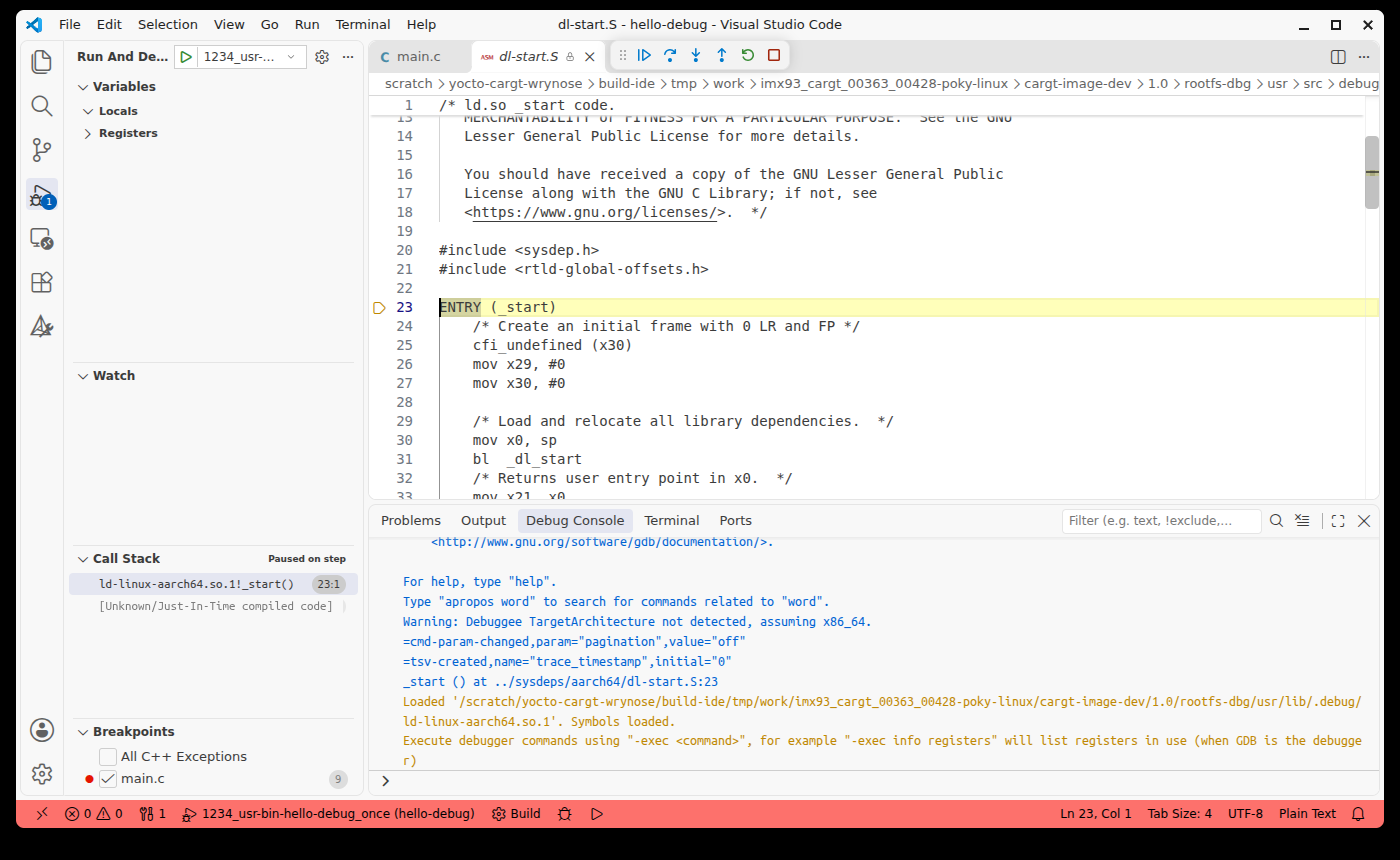
Then it starts gdbserver --once :1234 /usr/bin/hello-debug on the board
over ssh and connects the cross gdb to it. The generated configuration
stops at the program’s entry point, in the dynamic loader. The loader’s
own source is shown from rootfs-dbg, which shows that the library
symbols were found:
Press F5 again to run to the breakpoint. The Variables pane shows
the locals, and Call Stack shows add_squares called from main:
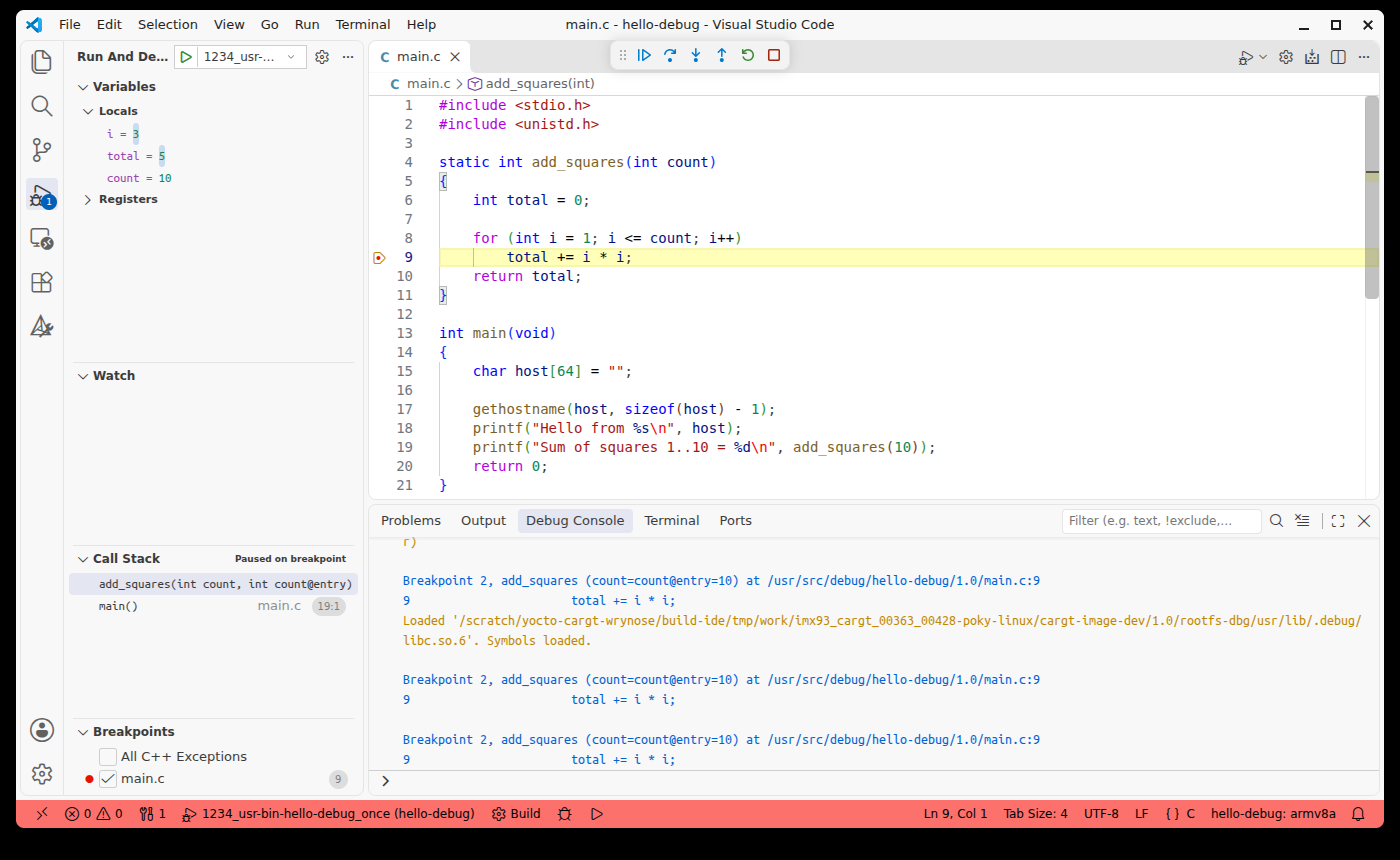
Edit, press F5, and the program is rebuilt, deployed and debugged
again. The program’s output goes to the gdbserver task in the
Terminal panel. Remove "stopAtEntry": true from launch.json to
run straight to your first breakpoint.
Note
If devtool ide-sdk prints ERROR: Cannot find the bitbake top
level folder, the install && deploy-target script it writes starts
with cd "None" and fails. devtool finds oe-init-build-env through
the Git repository of openembedded-core, so this happens when the
layers are not Git checkouts. A checkout made with repo as in
Yocto Development does not have this problem.
When you are done, remove the program from the board:
devtool undeploy-target hello-debug root@<board-ip>
Debugging with gdb on the Command Line
The same works without VS Code. Deploy the program with devtool
deploy-target (see Developing Applications and Kernel Modules), and start
gdbserver on the board:
root@imx93-cargt-00363-00428:~# gdbserver --once :1234 /usr/bin/hello-debug
Process /usr/bin/hello-debug created; pid = 983
Listening on port 1234
--once makes gdbserver exit when the debugger disconnects. On the
PC, use the cross gdb that devtool ide-sdk built, and point it at
the unstripped program and at rootfs-dbg. In the build directory:
GDB=$(grep -o '"miDebuggerPath": "[^"]*' ~/src/hello-debug/.vscode/launch.json | cut -d'"' -f4)
DBG=tmp/work/imx93_cargt_00363_00428-poky-linux/cargt-image-dev/1.0/rootfs-dbg
IMG=tmp/work/armv8a-poky-linux/hello-debug/1.0/image
$GDB -q \
    -ex "set sysroot $DBG" \
    -ex "set solib-search-path $DBG/usr/lib" \
    -ex "set substitute-path /usr/src/debug/hello-debug/1.0 $HOME/src/hello-debug" \
    -ex "file $IMG/usr/bin/hello-debug" \
    -ex "target remote <board-ip>:1234"
set sysroot tells gdb where to find the board’s libraries and their
symbols, and set substitute-path maps the source path compiled into the
program back to your source directory. Then debug as usual:
(gdb) break add_squares
Breakpoint 1 at 0xaaaaaaaa0968: file /usr/src/debug/hello-debug/1.0/main.c, line 5.
(gdb) continue
Breakpoint 1, add_squares (count=count@entry=10) at /usr/src/debug/hello-debug/1.0/main.c:5
5    {
(gdb) next
8            for (int i = 1; i <= count; i++)
(gdb) next
9                    total += i * i;
(gdb) info locals
i = 1
total = 0
(gdb) bt
#0  add_squares (count=count@entry=10) at /usr/src/debug/hello-debug/1.0/main.c:9
#1  0x0000aaaaaaaa09f4 in main () at /usr/src/debug/hello-debug/1.0/main.c:19
(gdb) info sharedlibrary
From                To                  Syms Read   Shared Object Library
0x0000fffff7fb0000  0x0000fffff8000000  Yes         .../rootfs-dbg/usr/lib/ld-linux-aarch64.so.1
0x0000fffff7e00000  0x0000fffff7fb0000  Yes         .../rootfs-dbg/usr/lib/libc.so.6
(gdb) continue
[Inferior 1 (process 983) exited normally]
Syms Read: Yes for the libraries means gdb found their symbols in
rootfs-dbg.
For a quick look without the cross gdb, gdb also runs on the board
itself in cargt-image-dev. It works without any setup, but the
installed programs and libraries are stripped, so it shows little more
than addresses for them.
Debugging on the Board with VS Code Remote-SSH
The Remote-SSH extension (ms-vscode-remote.remote-ssh) opens a folder
on the board in VS Code over ssh, as if it were local. Files, terminals,
builds and the debugger all run on the board, using the compiler and
gdb in cargt-image-dev. There is no Yocto build involved, so it is
the quickest way to try out a small program or edit scripts and
configuration files.
Important
Remote-SSH needs a board with at least 2 GB of RAM. With less, VS Code is slow and the server on the board can crash. On a 2 GB i.MX 93 board, memory in use went from about 320 MB to about 770 MB with a folder and a terminal open, and to about 1 GB while debugging with the C/C++ extension.
Connecting to the Board
Add the board to ~/.ssh/config on your PC, so that VS Code can list it
by name:
Host cargt-board
    HostName <board-ip>
    User root
Install the Remote-SSH extension, run Remote-SSH: Connect to Host… from the Command Palette (Ctrl+Shift+P), and choose the board:
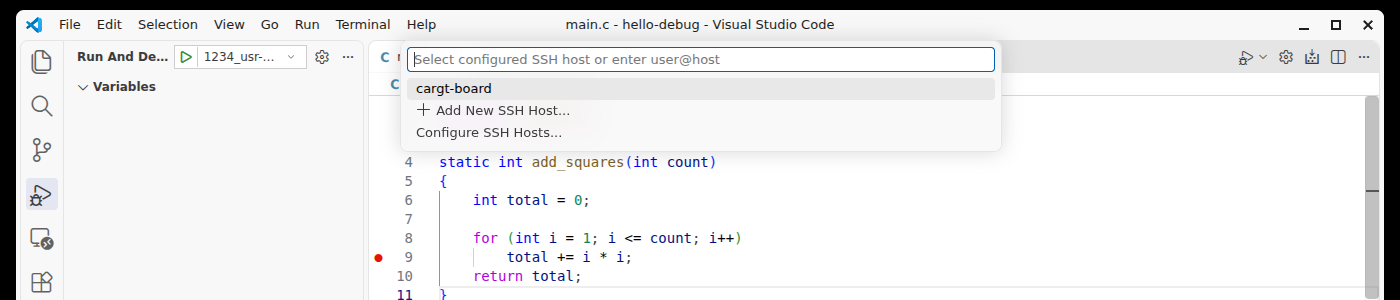
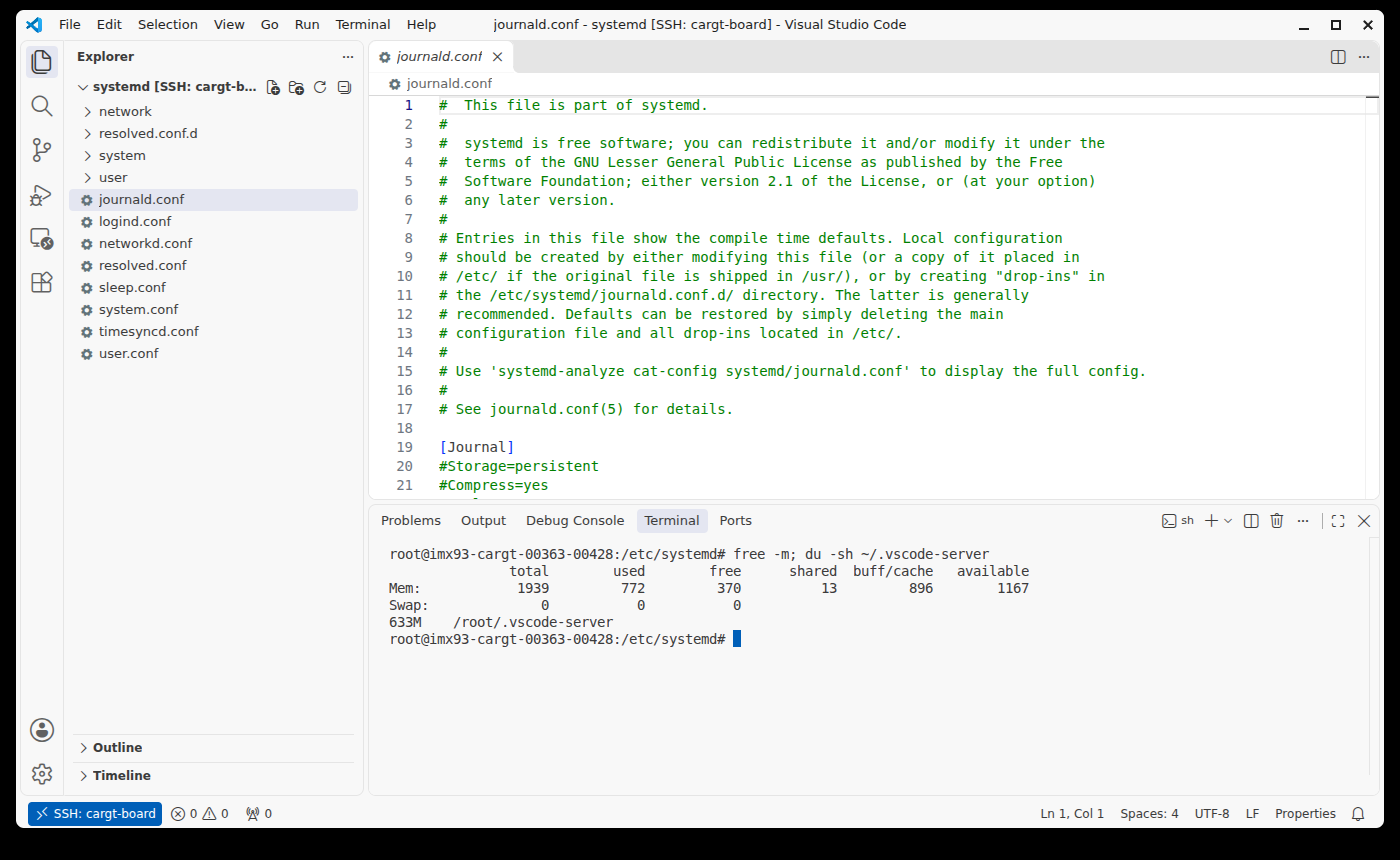
On the first connection, VS Code installs the VS Code Server in
~/.vscode-server on the board, which takes 633 MB. The board downloads
it from the internet, or VS Code copies it over ssh if the board has no
internet access. SSH: cargt-board in the status bar shows that the
window is connected, and terminals open on the board:
Debugging a Program on the Board
This example debugs the hello-debug program from above as
~/remote-demo/hello.c on the board. Open the folder over Remote-SSH,
and install the C/C++ extension on the board: extensions that work with
files run in the VS Code Server, so they are installed there separately.
In a terminal of the connected window:
root@imx93-cargt-00363-00428:~/remote-demo# code --install-extension ms-vscode.cpptools
Installing extensions on SSH: cargt-board...
Installing extension 'ms-vscode.cpptools'...
Extension 'ms-vscode.cpptools' v1.35.6 was successfully installed.
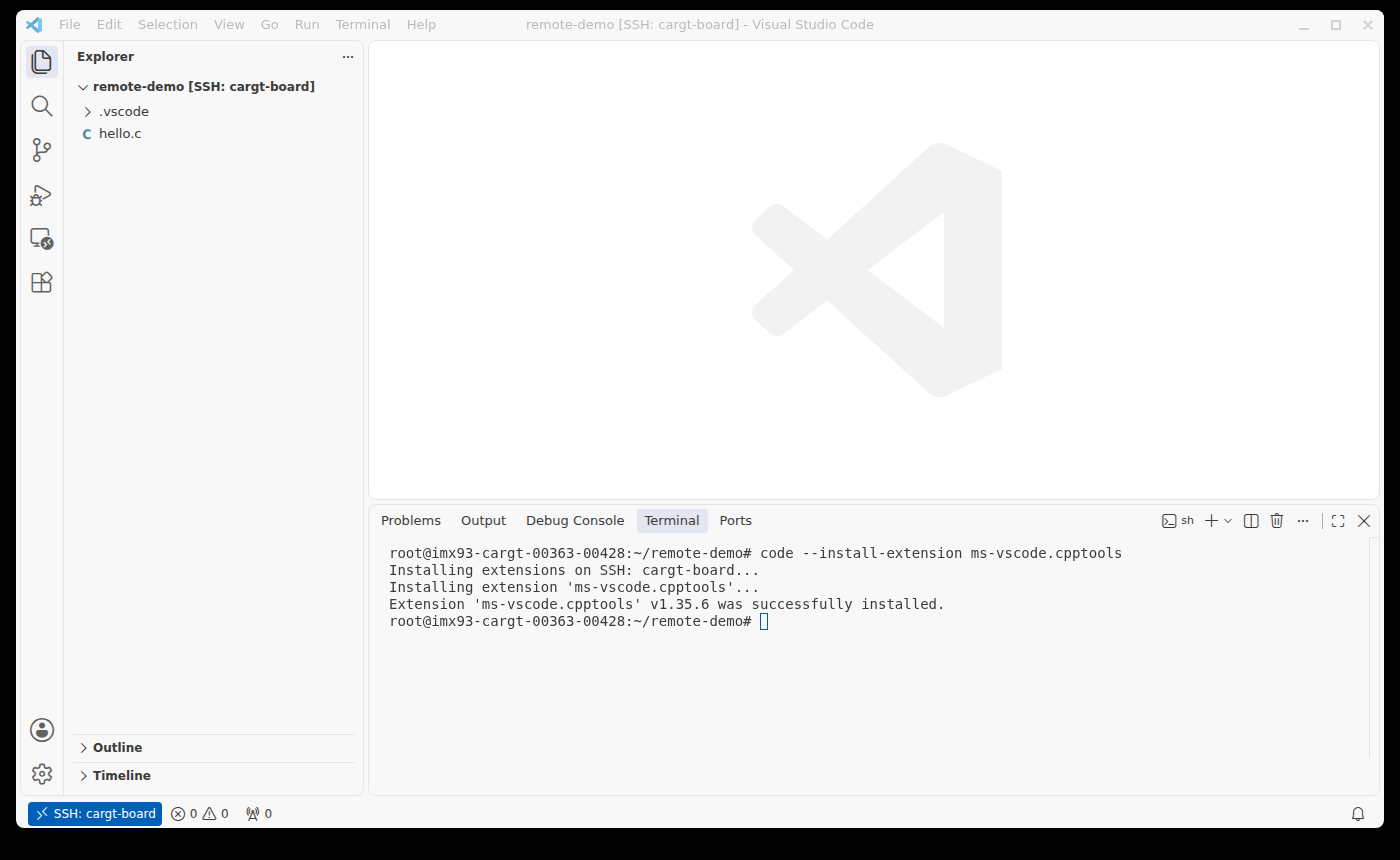
With the extension, ~/.vscode-server grows to about 1.1 GB. Add a build
task and a debug configuration in .vscode in the folder.
.vscode/tasks.json compiles the program with the board’s gcc,
without optimization so that every line can be stepped:
{
    "version": "2.0.0",
    "tasks": [
        {
            "label": "build hello",
            "type": "shell",
            "command": "gcc",
            "args": ["-g", "-O0", "-o", "hello", "hello.c"],
            "group": { "kind": "build", "isDefault": true },
            "problemMatcher": ["$gcc"]
        }
    ]
}
.vscode/launch.json builds the program and runs it under the board’s
gdb:
{
    "version": "0.2.0",
    "configurations": [
        {
            "name": "Debug hello on the board",
            "type": "cppdbg",
            "request": "launch",
            "program": "${workspaceFolder}/hello",
            "cwd": "${workspaceFolder}",
            "MIMode": "gdb",
            "miDebuggerPath": "/usr/bin/gdb",
            "preLaunchTask": "build hello"
        }
    ]
}
Open hello.c, click left of the line number of total += i * i; to
set a breakpoint, and press F5. VS Code builds the program, starts it
under gdb and stops at the breakpoint, with the local variables in
Variables and add_squares called from main in Call Stack:
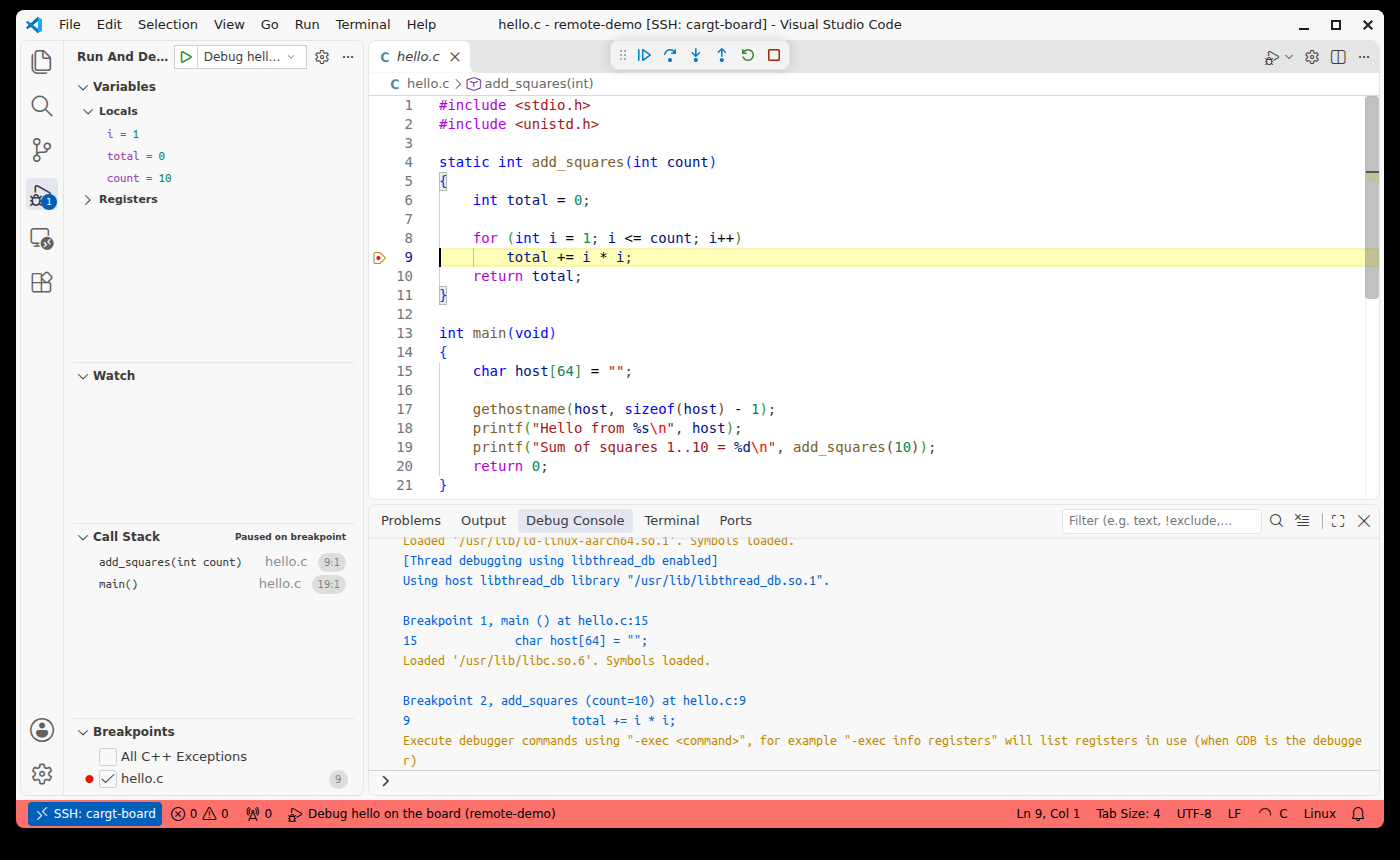
Press F5 to continue to the next pass of the loop, F10 to step over a line, and Shift+F5 to stop. The program’s output is in the Debug Console.
Limits of Remote-SSH
Everything under
/root, including~/.vscode-serverand your files, is on the root file system, which a full software update replaces (see Software Updates). Keep your work in Git on your PC or a server.The VS Code Server and its extensions take over 1 GB on the root file system. Check
df -h /first, and delete~/.vscode-serverwhen you no longer need it.Programs built on the board are built against what is installed on that board, not by your Yocto build. For programs that belong in a product, write a recipe and debug it with
devtool ide-sdkas above.